| network_time | altitude | vspeed | speed | latitude | longitude | callsign | |
|---|---|---|---|---|---|---|---|
| 2491 | 2024-05-21 07:52:03.483000+00:00 | 37000.0 | 0.0 | 502.0 | 16.32694 | 95.39330 | SIA321 |
| 2492 | 2024-05-21 07:52:06.221000+00:00 | 37000.0 | -64.0 | 504.0 | 16.28206 | 95.45134 | SIA321 |
| 2493 | 2024-05-21 07:52:09.301000+00:00 | 37000.0 | 0.0 | 504.0 | 16.27713 | 95.45766 | SIA321 |
| 2494 | 2024-05-21 07:52:12.409000+00:00 | 37000.0 | 0.0 | 505.0 | 16.27303 | 95.46295 | SIA321 |
| 2495 | 2024-05-21 07:52:15.521000+00:00 | 37025.0 | 64.0 | 505.0 | 16.26842 | 95.46893 | SIA321 |
Introduction
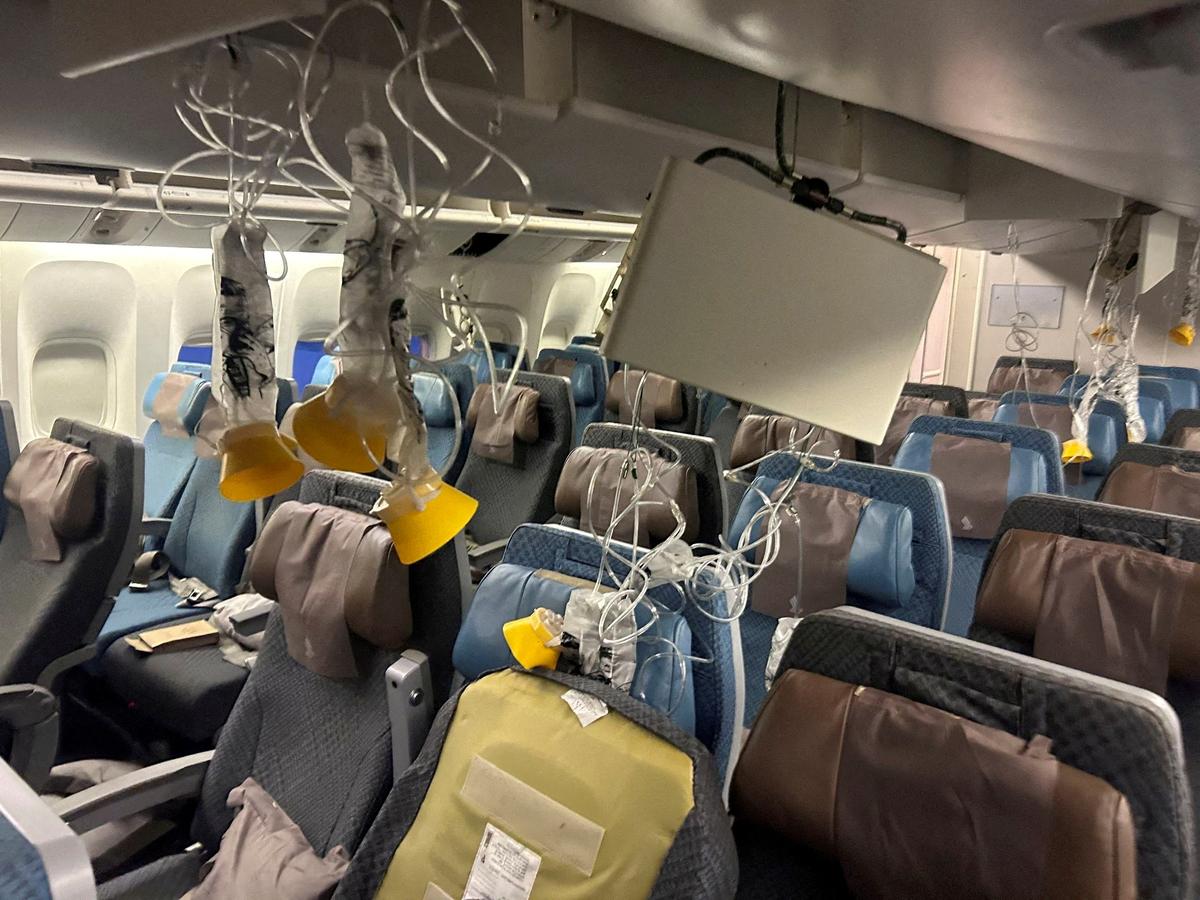
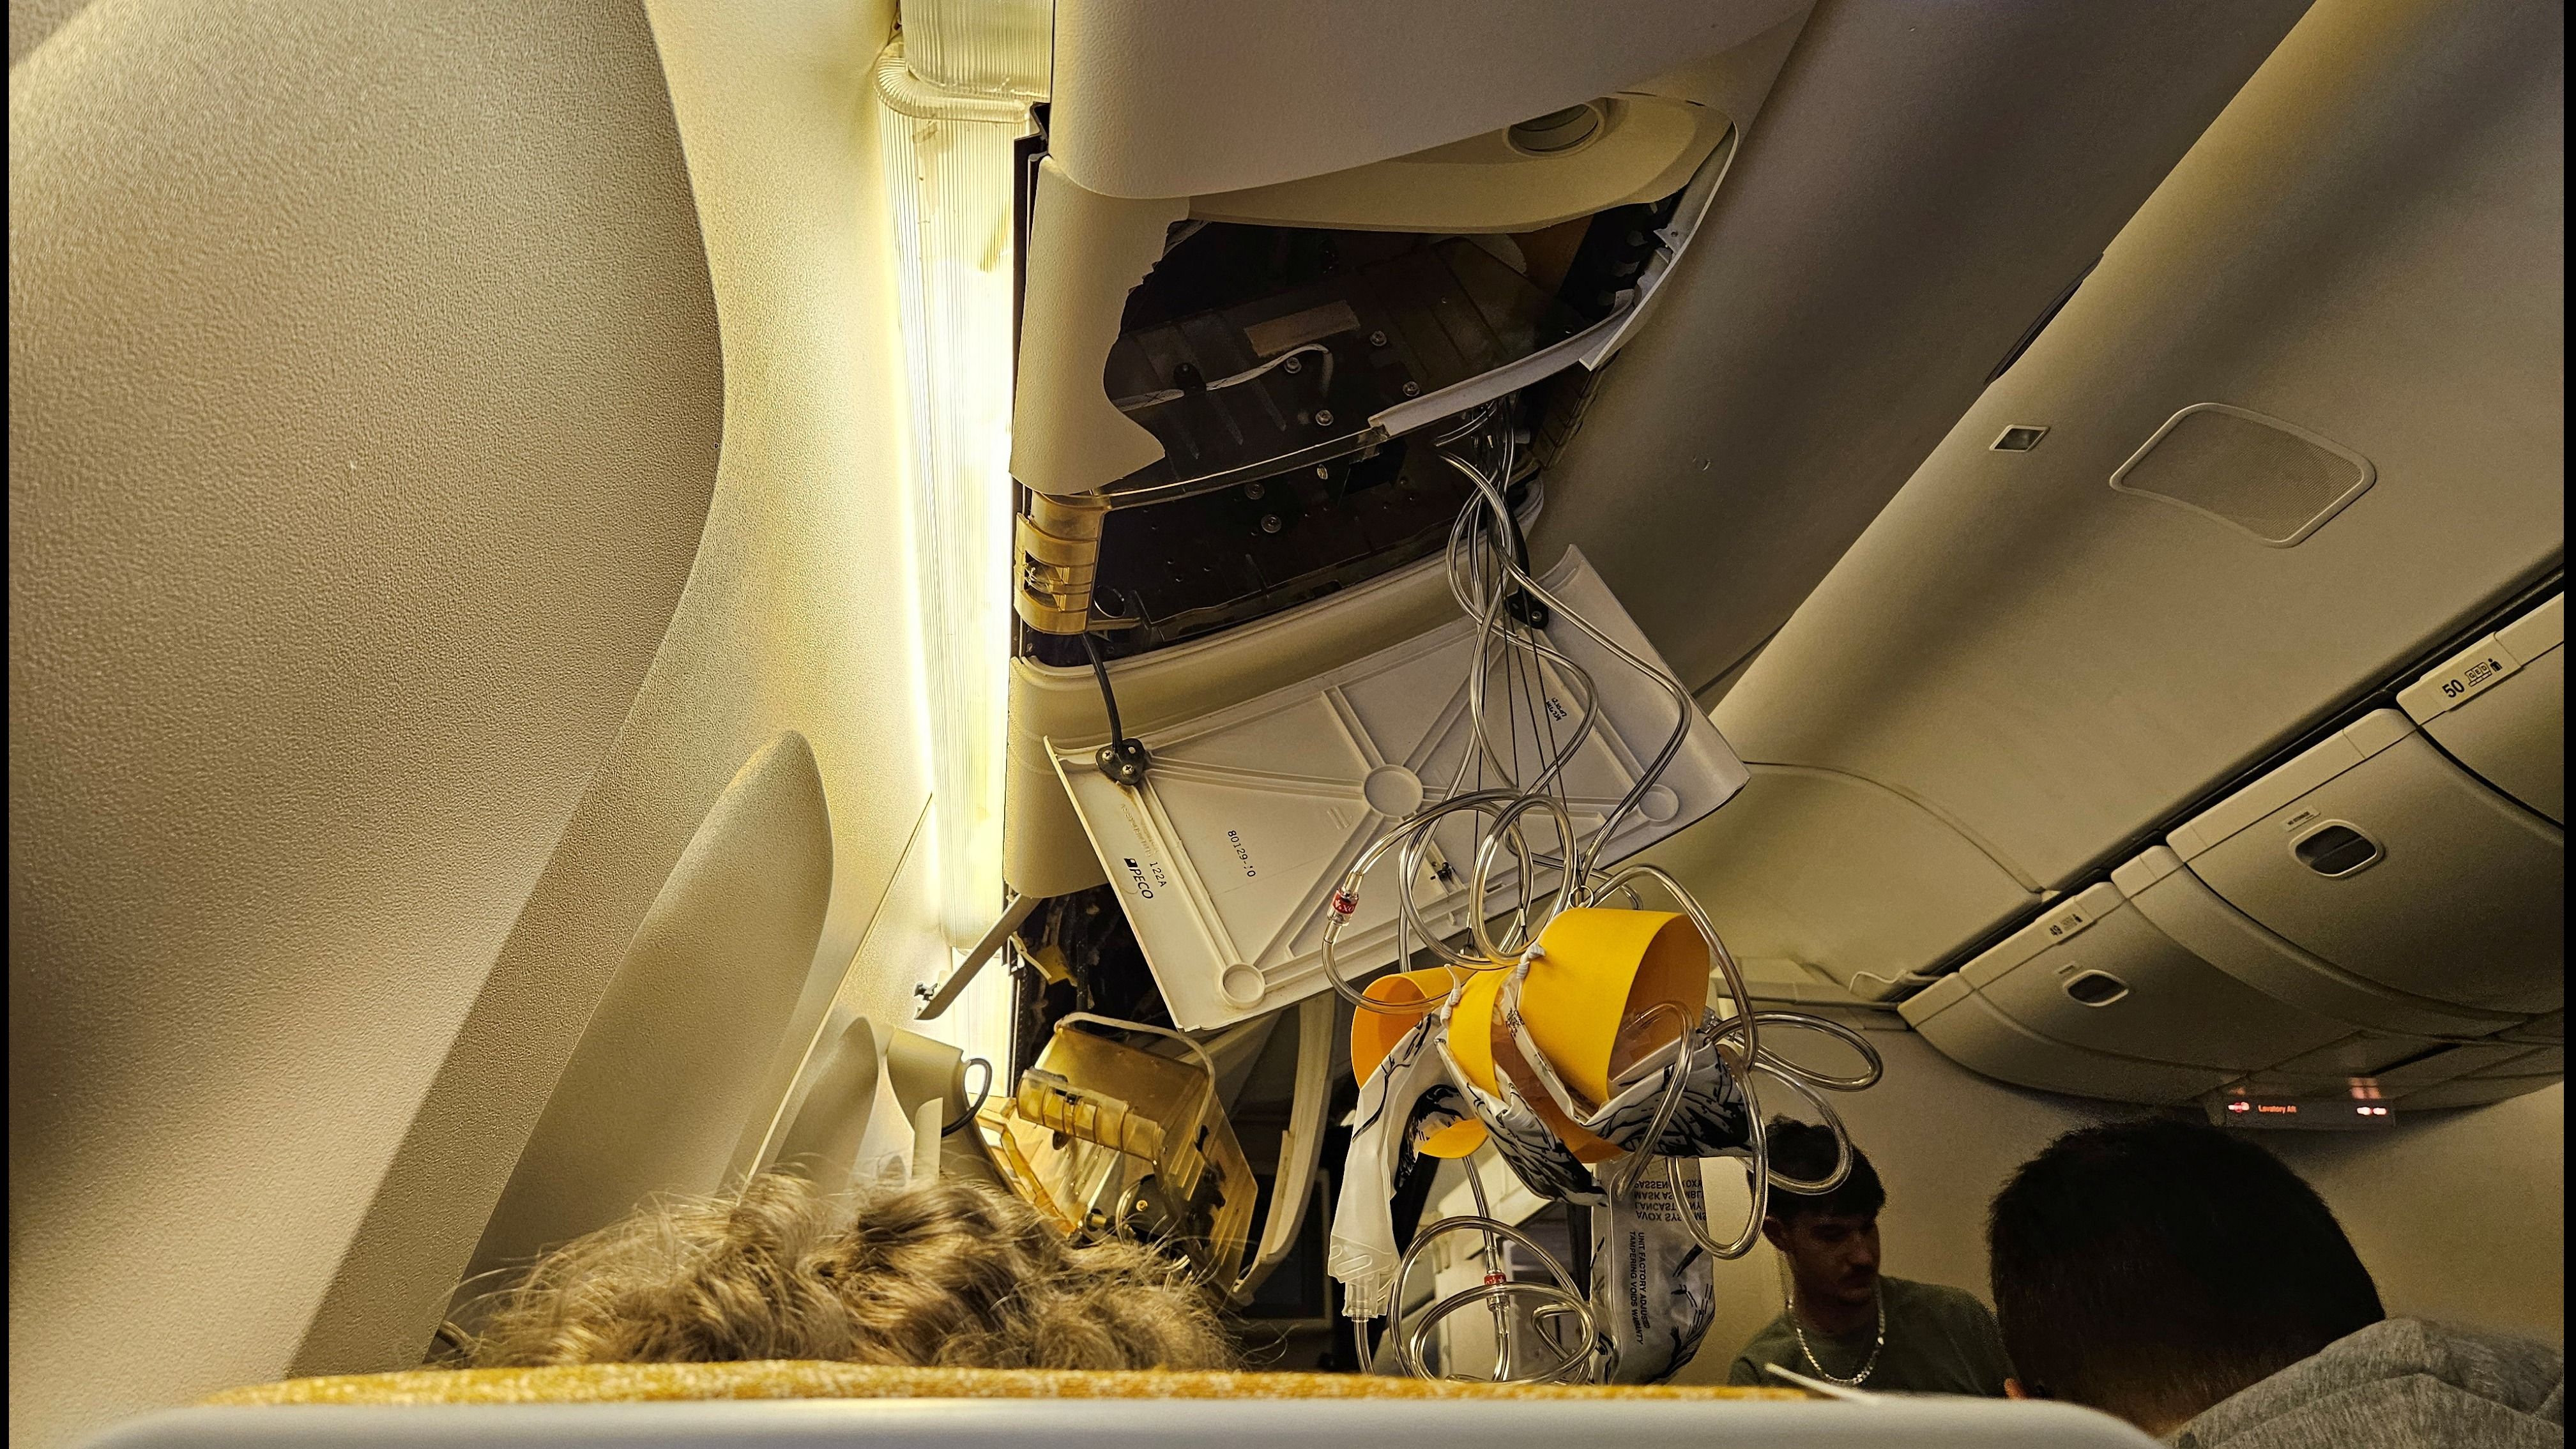
A severe flight turbulence incident occured earlier this year on May 20 and it was widely reported across many news sites. Tragedy loomed over the incident as the turbulence resulted not only in severe shocks and injuries to many passengers but also resulted in the death of one person ! Some passengers not wearing seatbelts were thrown upwards from their seat and they hit their head on the cabin ceiling resulting in serious injuries ! Photos of damaged overhead baggage bins and oxygen masks dangling from the overhead ceiling compartments were widely seen on the internet.
The flight in question was Singapore Airlines flight SQ321 that departed from London to Singapore on 20-May-2024. The turbulence incident occurred on the morning of 21-May-2024 UTC, and soon after, the aircraft initiated an emergency diversion to Bangkok where it landed smoothly. Medical personnel entered the aircraft to attend to the injured passengers.
What exactly could have happened ?!
Some of the news reports that were encountered talked about a sudden drop in altitude as being the problem. They also talked about a ‘rapid change in gravitational force’ which certainly sounded somewhat loose. Below are excerpts from the news articles that appeared in the news feeds
Flight dropped 6,000 feet in 3 mins
According to an analysis by The Associated Press, the flight was cruising at 37,000 feet before suddenly plummeting to 31,000 feet over about three minutes. The aircraft remained at this lower altitude for under 10 minutes before diverting to Bangkok.[1]
Singapore Airlines plane dropped 54 metres in seconds, flight data shows
Investigation report says aircraft ‘experienced a rapid change in gravitational force’ during turbulence [2]
Clearly, turbulence is very common in flights, particularly during the descent for landing. This often produces empty stomach feelings due to sudden drop in altitude, similar to the “free fall” sensations exprerienced during drops in amusement park roller coasters. Though relatively less frequent and usually less intense, turbulence at crusing altitude is also quite common. Usually it results in low to moderate bumpiness and passengers are advised to return to their seats and buckle up. Typiclally, within a few minutes, things are back to normal.
The primary question that comes up from a Physics point of view is:
1. “What is the type of motion that must happen to an airplane for passengers to be thrown upward so forcibly that they fly upwards and hit the ceiling ?”
and an associated follow up question is:
2. “Did the turbulence take place at cruising altitude ?”
References:
[1] https://www.business-standard.com/world-news/singapore-airlines-turbulence-6-000-feet-drop-in-3-mins-singapore-airlines-flight-s-mid-air-chaos-watch-124052200238_1.html
[2] https://www.theguardian.com/world/article/2024/may/29/singapore-airlines-turbulence-altitude-drop-flight-data
Hypothesis
Let us think about Question 1. The first thought is that vertical downward motion at an acceleration greater than g (i.e. acceleration due to gravity - about 9.8 \(m/s^2\) or 32 \(ft/s^2\)) can cause an unbelted passenger to be hurled towards the ceiling. But how likely is it that a plane would barrel downwards at such high acceleration ? It would be faster than free fall, and unless the aircraft is made to do a downward dive, such movement is very unlikely. Such maneuvers are sometimes performed by fighter jets in a tactical environment but not by commercial passenger jet liners. Turbulence in the atmosphere is mostly due to movement of pockets of air much larger than an aircraft. If the whole air pocket moves up or down, the aircraft is carried up or down with it.
Are there any other possibilities that come to mind ? If the airplane moves upward and downward repeatedly, it is indeed possible for objects and passengers to be jerked up and down. We actually utilize such movements to knock off dust from a dirty cloth, for example. If these movements are abrupt and intense enough, it could indeed result in passengers getting injured in the way that happened on the flight. We should be able to analyze the flight data and figure out if such movements occured for this flight at the time of the incident.
With regard to question 2, we know that the aircraft initiated an emergency diversion and descent to Bangkok shortly after the incident, instead of continuing on to the final destination Singapore. And the news articles also mentioned that the turbulence occurred at 37000 ft which is a cruising altitude. We should be able to validate that from the flight data as well.
In summary, our hypothesis is that there was abrupt, intense, jerky up and down movement when turbulence hit the aircraft at cruising altitude. Such movement would have to be somewhat extreme to produce the kind of severe outcomes that occurred. Analysis of publicly available flight data can allow us to check this hypothesis, and hopefully obtain much deeper qualitative and quantitative insights into the motion of the aircraft during the period of presumably extreme turbulence. We embark on that exploration next.
Flight data
Overview of the flight data
Recent flight data is available from sites like FlightAware and Flightradar24. The flight in question is Singapore Airlines fight SQ321 that departed from LHR on 20-May-2024. Basic flight details are available at FlightAware and more detailed data for the last part of the flight is available at Flightradar24. The flight data provides a good amount of information but for our analysis it is important to note that altitude (in feet) and vertical speed (in feet per minute) are provided at approximately 3 second intervals. By analyzing the time variation of these quantities, we should be able to study the drops in altitude and the changes in vertical speed around the time of the turbulence, and thereby test our hypothesis.
Shown below is a snippet of flight data that shows a few rows with some of the significant columns included. The altitude column provides the altitude in feet (ft) and the vspeed column provides the vertical speed in feet per minute (ft/min). We convert it to feet per second (ft/sec) in our analysis.
Along with network_time which provides the timestamp for the data item or row, these two columns altitude and vspeed are the most relevant for our analysis as they relate to upward and downward movements. If the aircraft is cruising smoothly at high altitude, the value of altitude will remain almost constant with time and vspeed will be close to zero.
Some other available columns are speed which records ground speed in miles per hour (mph), latitude, longitude, and callsign which is a flight identifier (viz. SIA321 in this case).
The data items or rows are available at roughly 3 second intervals for the duration of our interest. This is related to how Flightradar24 acquires its data. [3]
[3] How does Flightradar24 track Aircraft ? https://www.flightradar24.com/blog/how-does-fr24-track-aircraft/
When did the turbulence occur ?
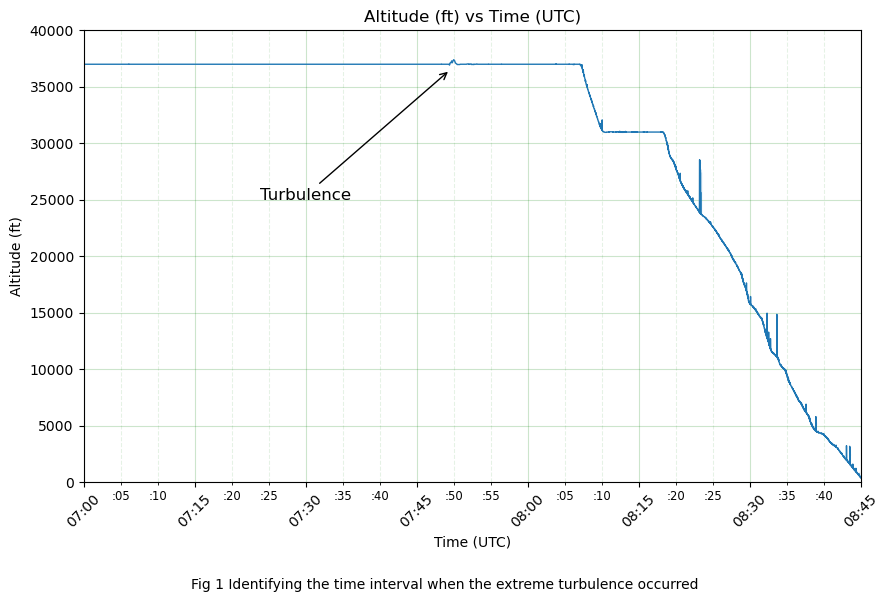
Based on the plot in Fig 1 below, the kink around 07:50 UTC is a telltale indicator of the turbulence incident. It is important to understand that the descent for landing is not where the turbulence incident of interest occured. There are continued steep drops in altitude during the descent for landing and the magnitude of these drops are way more than the height of the “altitude kink” that we see at the time of the extreme turbulence event. Turbulence was likely present during the descent as well, and there were altitude changes, but those tend to be characteristic of a lot of landings in inclement weather. Such changes generally cauase discomfort and sometimes vomiting. But it is generally rare for these to result in injuries. Also the passengers and crew including the pilots are mostly expecting a bumpy ride during that time and thus, everyone has their seatbelts well-fastened and have the safety procedures in mind.
Thus, we already have the answer to Question 2. Indeed the turbulence incident that we are studying did occur at a cruising altitude of about 37000 feet ! Next we get down to studying the motion of the aircraft during the “kink” which represents the turbulent phase. Specifically we go deeper into the movements during the interval 07:49:00 to 7:51:00 UTC.
Movement of the aircraft during turbulence
Changes in Altitude and Vertical Velocity
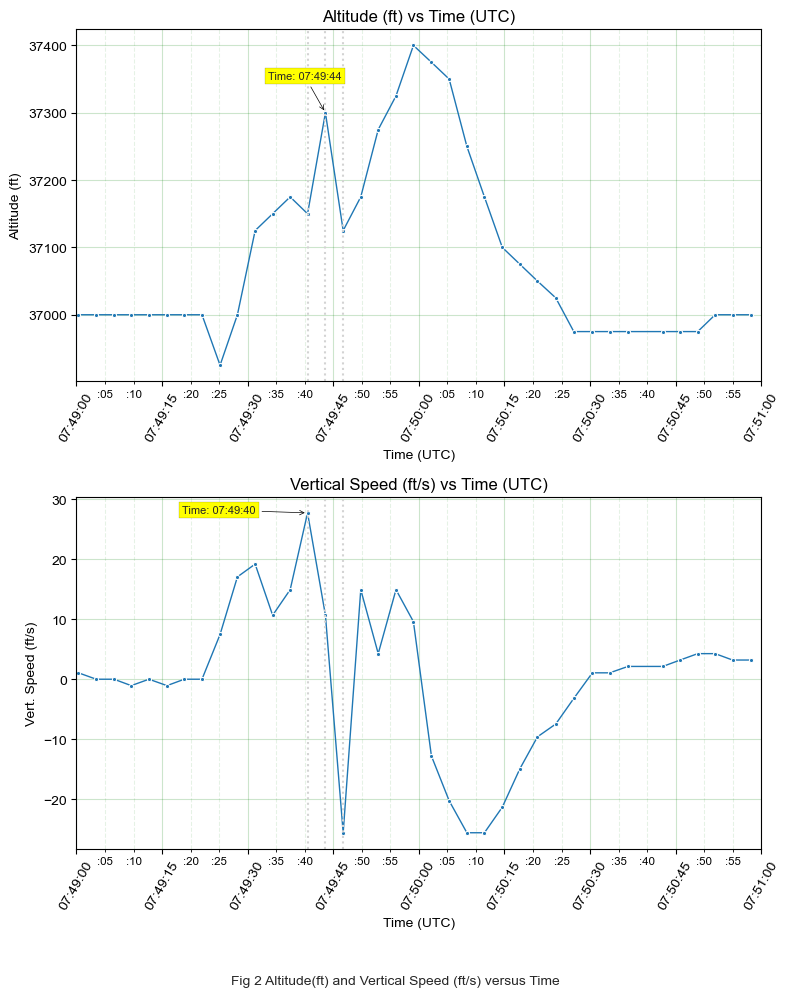
The upper plot in Fig 2 shows the variation in altitude during the period of turbulence which is about 2 minutes from 7:49 am to 7:51 am UTC. The lower plot shows the variation in vertical speed during the same interval. Note that the plots share the same time axis although they are labelled separately for both. This makes it convenenient to analyze the joint variation of the quantities with time.
We observe that during the interval 7:49:40 to 7:49:47, a period of about 7 seconds marked by the dotted grey vertical lines, there is initially a sharp increase in altitude till 7:49:44 (about 4 seconds) and then an even sharper drop in altitude over the next 3 seconds. This is very much in line with our hypothesis ! The aircaft was moving upward sharply and then it suddenly started moving downward even more sharply. The range of altitude change was less than 200 ft but the sharpness of the change in direction from upward to downward was quite extreme !
We can now study the lower plot to gain a deeper understanding. The upward direction is taken as positive and the downward direction as negative for the vertical velocity as recorded in the flight data. At approximately 7:49:40, the aircraft reached a peak upward vertical speed of about 27 ft/s and by 7:49:47, its vertical speed had changed to 23 ft/s downward. Somewhere just after 7:49:44, the velocity changed direction (sign) from upward to downward. This makes sense as the altitude started to drop after this point in time on the upper plot.
It is hard to determine the actual acceleration that was experienced by the aircraft during this interval of abrupt changes in both magnitude and direction of vertical speed. The vertical speeds of 27 ft/s upward to 23 ft/s downward are not that extreme but these are average values of short intervals and not instantaneous values. This is because our data is at a 3 second granularity only, and we are not able to study the exact motion in between the 3 second intervals. But it is clear that our initial hypothesis is not disproved by the data. In fact, the data appears to lend support to it !
Note that a couple of rounds of similar upward and downward movements continued to happen. But we do not present the analysis of those here - they can be dealt with in a similar fashion as above. They are not fundamentally different from the movements we have analyzed above. Although a couple of the altitude increases and drops appear larger, the change from vertical upward motion to vertical downward motion is not as intense ! Similarly there were smaller jerks preceding the interval we have analyzed.
Instead, we continue next to an analysis of the vertical acceleration with the hope that it can validate the above inferences, and it could even provide more insight.
Changes in Vertical Acceleration
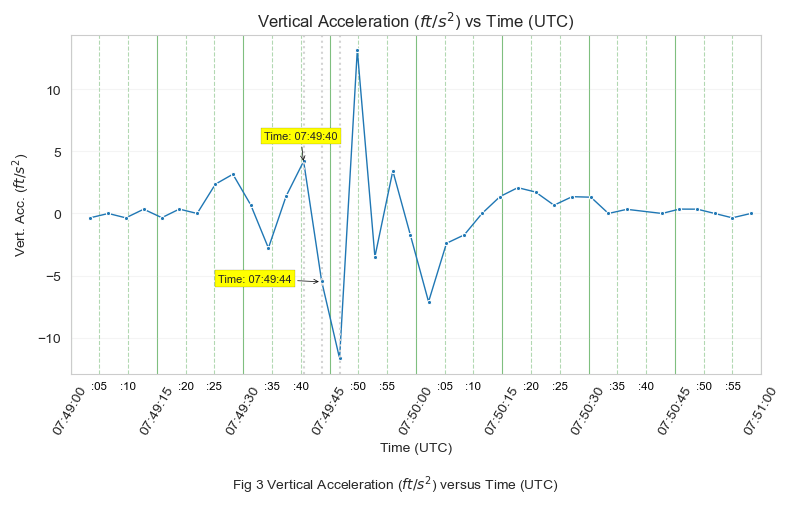
Fig 3 above shows a plot of the vertical acceleration as a function of the time. The upward direction is positive and the downward direction is negative just as in the vertical velocity plot in Fig 2.
At 07:49:40 the upward acceleration (positive) reached a peak, and by 7:49:44 the aircraft had acquired a downward acceleration (negative) of slightly higher magnitude. This resulted in a dececeleration of the upward motion and a rapid transition to a downward motion. All of this occurred after the acceleration turned downward (negative) and kept increasing in magnitude. Thus, the acceleration turned negative first and then the velocity turned negative, as we would expect since the aircraft was moving upwards initially.
Since acceleration results from unbalanced forces as per Newton’s laws of motion, it would be appropriate to think about them. We can attribute the postive upward acceleration to strong updrafts characteristic of turbulence. But how did the aircraft start accelerating downward ? We can hypothesize that the autopilot attempted to arrest the rapid increase in altitude, or maybe the pilot did something similar via manual control. But that topic is outside the scope of our study that is limited to investigation of the kind of motion that can launch passengers upward vigorously towards the ceiling. And what we find in this plot surely provides even more support to our hypothesis !
Schematic Animation of the vertical movements
Finally, below is an animation which is a simplified attempt to capture the altitude variations in clock time. If the video does not start on its own, press the Play button to start it. At 3 second intervals, the altitude is updated as per the flight data and the position of the aeroplane is refreshed to show its altitude variations. This is similar in spirit to how position is updated on an old-fashioned radar screen. The idea is to provide a very rough idea of the abruptness of the vertical motion.
For simplicity, the icon shows the aeroplane in horizontal position and assumes a fixed horizontal speed. This consistent with our approach of analysing only altitude and vertical speed available from the flight data. The actual direction of motion of the aircraft is determined by the vector sum of the vertical and horizontal speeds. However, from the flight data it is seen that the horizontal speed is nearly constant throughout the interval - quantitively, it is seen that mean=499.95, stdev=2.99, min=495.00, max=509.00 (all in mph). Thus, our approximation appears to be reasonably realistic.
Conclusion
Based on the above analysis, we can conclude that the initial hypothesis stands on solid ground. The airline would have access to more detailed data from the flight data recorder on the aircraft and they would be able to carry out a much more exhaustive analysis that includes not only the aircraft movements but also the actions taken by the airline crew. That should provide them knowlegde and insights for improving their emergency flight procedures. But it is satisfying that we were able to use public flight data to do a reasonably good analysis that is more elaborate and convincing than what the initial news articles stated just after the incident.
Flight turbulence is an area of concern today as it is predicted to become more severe due to global warming and the associated changes to airflow patterns at high altitudes in particular. Aircraft manufacturers and airline operators are liklely to take action to address the challenges that may arise from increased turbulence.